Strategy Tester Report
AlpariUK-Demo (Build 225)
| Symbol | EURUSD (Euro vs US Dollar) | ||||
| Period | 1 Hour (H1) 2009.12.01 00:00 - 2010.01.15 22:00 (2009.12.01 - 2010.01.17) | ||||
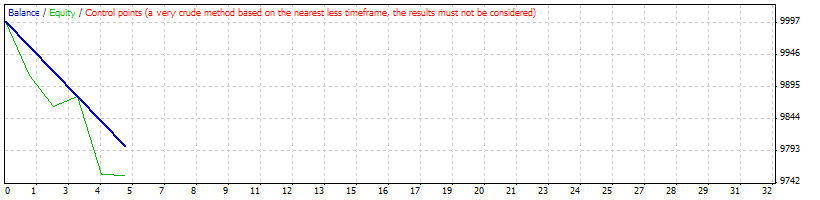
| Model | Control points (a very crude method, the results must not be considered) | ||||
| Parameters | period=55; SL=40; TakeProfit=50; Lots=1; risk=5; incTp=0; TrailingStop=18; expiryhour=1; variance=5; maxtrades=15; Selectivity=14; MM=false; | ||||
| Bars in test | 1753 | Ticks modelled | 19953 | Modelling quality | n/a |
| Mismatched charts errors | 1 | ||||
| Initial deposit | 10000.00 | ||||
| Total net profit | -200.00 | Gross profit | 0.00 | Gross loss | -200.00 |
| Profit factor | 0.00 | Expected payoff | -40.00 | ||
| Absolute drawdown | 200.00 | Maximal drawdown | 200.00 (2.00%) | Relative drawdown | 2.00% (200.00) |
| Total trades | 5 | Short positions (won %) | 3 (0.00%) | Long positions (won %) | 2 (0.00%) |
| Profit trades (% of total) | 0 (0.00%) | Loss trades (% of total) | 5 (100.00%) | ||
| Largest | profit trade | 0.00 | loss trade | -40.00 | |
| Average | profit trade | 0.00 | loss trade | -40.00 | |
| Maximum | consecutive wins (profit in money) | 0 (0.00) | consecutive losses (loss in money) | 5 (-200.00) | |
| Maximal | consecutive profit (count of wins) | 0.00 (0) | consecutive loss (count of losses) | -200.00 (5) | |
| Average | consecutive wins | 0 | consecutive losses | 5 | |
| # | Time | Type | Order | Size | Price | S / L | T / P | Profit | Balance |
| 1 | 2009.12.03 15:20 | sell | 1 | 1.00 | 1.50631 | 1.50671 | 1.50581 | ||
| 2 | 2009.12.03 15:22 | s/l | 1 | 1.00 | 1.50671 | 1.50671 | 1.50581 | -40.00 | 9960.00 |
| 3 | 2009.12.22 08:32 | buy | 2 | 1.00 | 1.43286 | 1.43246 | 1.43336 | ||
| 4 | 2009.12.22 08:40 | s/l | 2 | 1.00 | 1.43246 | 1.43246 | 1.43336 | -40.00 | 9920.00 |
| 5 | 2009.12.22 12:20 | sell | 3 | 1.00 | 1.42917 | 1.42957 | 1.42867 | ||
| 6 | 2009.12.22 12:22 | s/l | 3 | 1.00 | 1.42957 | 1.42957 | 1.42867 | -40.00 | 9880.00 |
| 7 | 2010.01.08 14:45 | buy | 4 | 1.00 | 1.43805 | 1.43765 | 1.43855 | ||
| 8 | 2010.01.08 14:47 | s/l | 4 | 1.00 | 1.43765 | 1.43765 | 1.43855 | -40.00 | 9840.00 |
| 9 | 2010.01.12 12:20 | sell | 5 | 1.00 | 1.44617 | 1.44657 | 1.44567 | ||
| 10 | 2010.01.12 12:22 | s/l | 5 | 1.00 | 1.44657 | 1.44657 | 1.44567 | -40.00 | 9800.00 |